
JOLTS: what it is, how it’s calculated, and what it means
The job market right now: openings, hiring and quits
Every month, about 21,000 workplaces tell the government how many jobs they’re trying to fill, how many people they hired, and how many people left. That report, called JOLTS, is the clearest official view of whether people are moving between jobs or staying put.
Latest data marks the parts that update with each release. Everything else explains how JOLTS works.
What’s the job market like right now?
Openings came back. Hiring didn't.
Job openings rate and hires rate, percent, monthly since Dec 2000. Shaded bands are recessions.
For most of the 2000s and early 2010s, the hiring rate ran above the openings rate: employers filled jobs about as fast as they posted them. That flipped around 2015. Openings soared in 2021 and 2022 while hiring rose only a little. Today openings sit near their 2019 level, but the hiring rate has been running at its slowest pace since 2013.
Show yearly averages as a table
| Year | Openings | Hires | Quits | Layoffs |
|---|---|---|---|---|
| 2026 (Jan–Sep) | 4.4% | 3.3% | 2.0% | 1.1% |
| 2025 | 4.3% | 3.3% | 2.0% | 1.1% |
| 2024 | 4.7% | 3.4% | 2.1% | 1.1% |
| 2023 | 5.6% | 3.8% | 2.4% | 1.1% |
| 2022 | 6.9% | 4.2% | 2.8% | 1.0% |
| 2021 | 6.4% | 4.3% | 2.7% | 1.0% |
| 2020 | 4.3% | 4.3% | 2.1% | 2.4% |
| 2019 | 4.5% | 3.9% | 2.3% | 1.2% |
| 2018 | 4.6% | 3.9% | 2.3% | 1.2% |
| 2017 | 4.0% | 3.7% | 2.2% | 1.2% |
| 2016 | 3.9% | 3.7% | 2.1% | 1.2% |
| 2015 | 3.8% | 3.7% | 2.0% | 1.3% |
| 2014 | 3.3% | 3.6% | 1.8% | 1.3% |
| 2013 | 2.9% | 3.4% | 1.7% | 1.3% |
| 2012 | 2.8% | 3.3% | 1.5% | 1.4% |
| 2011 | 2.6% | 3.3% | 1.5% | 1.4% |
| 2010 | 2.2% | 3.2% | 1.4% | 1.4% |
| 2009 | 1.9% | 3.0% | 1.3% | 1.7% |
| 2008 | 2.7% | 3.4% | 1.9% | 1.5% |
| 2007 | 3.3% | 3.9% | 2.1% | 1.4% |
| 2006 | 3.3% | 3.9% | 2.2% | 1.4% |
| 2005 | 3.0% | 4.0% | 2.1% | 1.5% |
| 2004 | 2.7% | 3.8% | 1.9% | 1.5% |
| 2003 | 2.4% | 3.7% | 1.8% | 1.5% |
| 2002 | 2.6% | 3.7% | 2.0% | 1.5% |
| 2001 | 3.2% | 4.0% | 2.2% | 1.6% |
Rates are seasonally adjusted. Openings rate = openings ÷ (filled jobs + openings). Other rates = count ÷ employment. Source: BLS JOLTS via FRED. Download the monthly rates (CSV).
Which industries are hiring right now, and where?
In September 2026, health care and the smallest businesses had some of the highest openings rates, while finance had some of the lowest hiring. Pick a measure, then find your industry.
Jobs employers are trying to fill, as a share of all jobs. Nationally: 4.5% in Sep 2026.
By region
- Northeast4.3%+0.1 pts vs. a year ago
- South4.4%−0.3 pts vs. a year ago
- Midwest4.6%+0.2 pts vs. a year ago
- West4.8%+1.0 pts vs. a year ago
JOLTS publishes four regions monthly. State figures come out once a year, and there are none for cities.
By industry
How many people are getting hired, and how many are leaving?
Picture the job market as a bathtub. Hires pour in. Quits, layoffs, and other separations drain out. Openings are the seats employers are still trying to fill. In September 2026, 5.4M people were hired and 5.3M left jobs.
- Job openings
- Jobs employers are trying to fill on the last business day of the month: a real job, able to start within 30 days, recruited from outside.
- Tells you how much employers want workers.
- Hires
- Everyone added to a payroll during the month, including rehires, part-time, and seasonal workers.
- Tells you how many people are actually getting into jobs.
- Quits
- People who left on their own, not counting retirements.
- Tells you how confident workers feel about finding something better.
- Layoffs & discharges
- Separations the employer started: layoffs, firings, downsizing, and the end of short-term jobs.
- Tells you how much pressure employers are under.
- Other separations
- Retirements, transfers to another location, disability, and deaths.
- Tells you usually small and steady, so rarely the story.
- Total separations
- Quits, layoffs, and other separations added together.
- Tells you how many people left a job for any reason.
What does this mean for my job, or my job search?
Signals, not verdicts. These hold whatever the month: JOLTS describes the whole market, not your job, and here’s how its signals can show up in a working life.
When hiring is slow, searches take longer
If your search is dragging, that’s partly the market, not a verdict on you. Plan for a longer runway.
When quits are high, you may have more leverage
Employers work harder to keep people when others are leaving. It can be a good moment to talk about pay or scope.
When quits are low, people are staying put
A reason to invest where you are, with a bigger project, a new skill, or a clearer path.
When layoffs rise, employers are under pressure
Not a reason to panic, but a good time to keep your record of wins current and stay in touch with people you trust.
None of these tell you whether to stay or go. They describe the field you’re playing on, so your next move starts from what’s real.
Share these charts
The pictures on this page, ready to post or print, updated with every release.
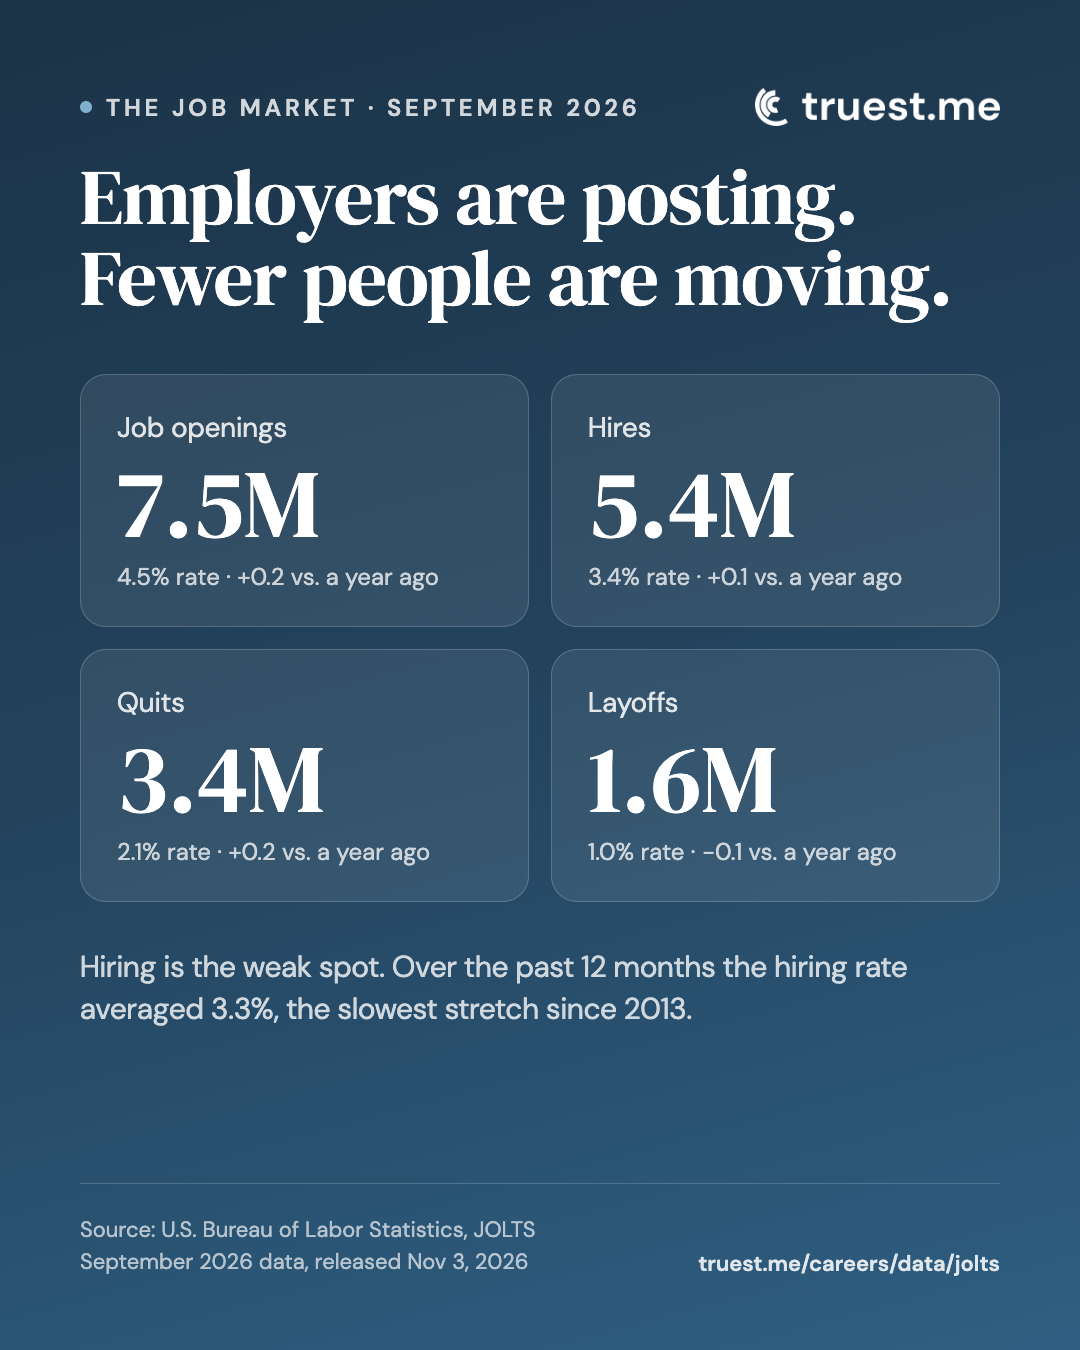
The month at a glance
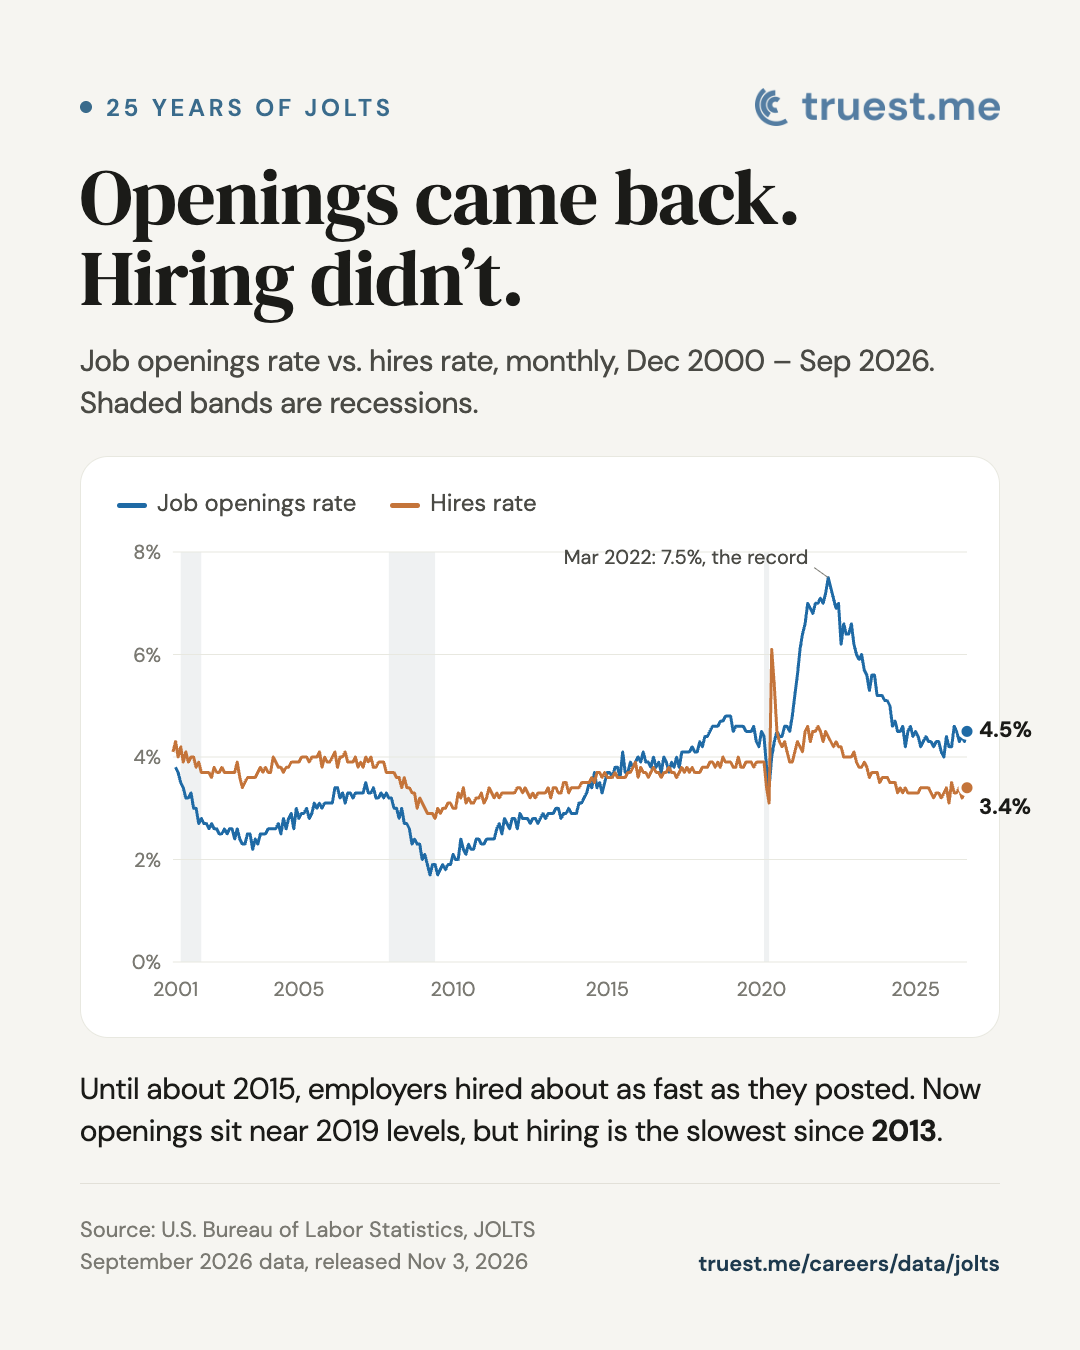
Openings vs. hires, 25 years
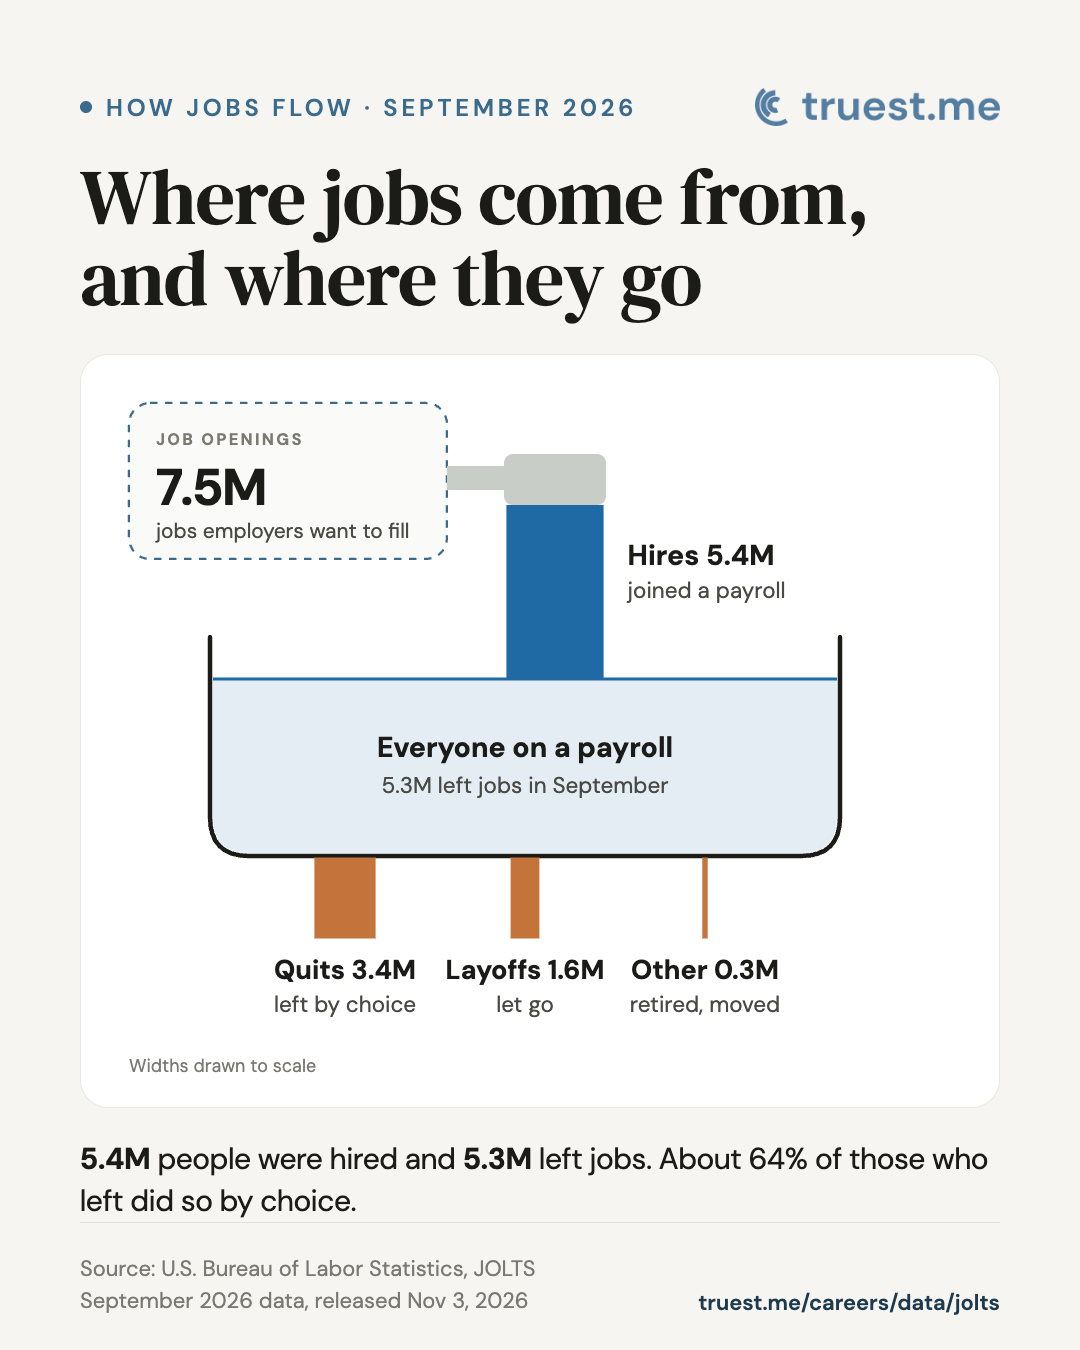
Where jobs come from, and where they go
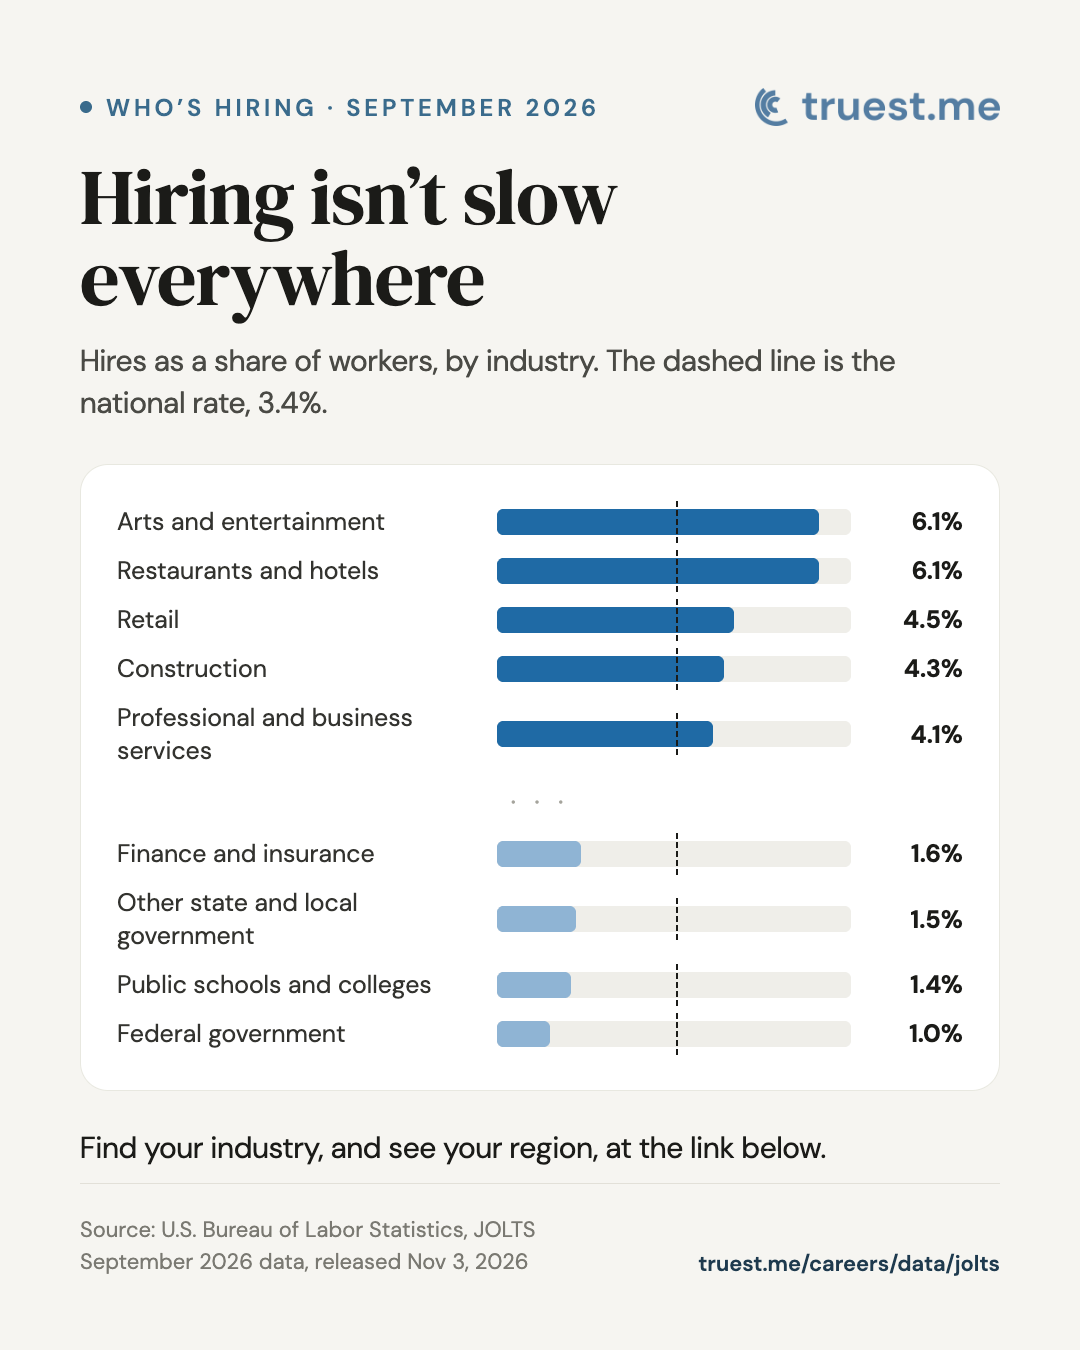
Who’s hiring, by industry
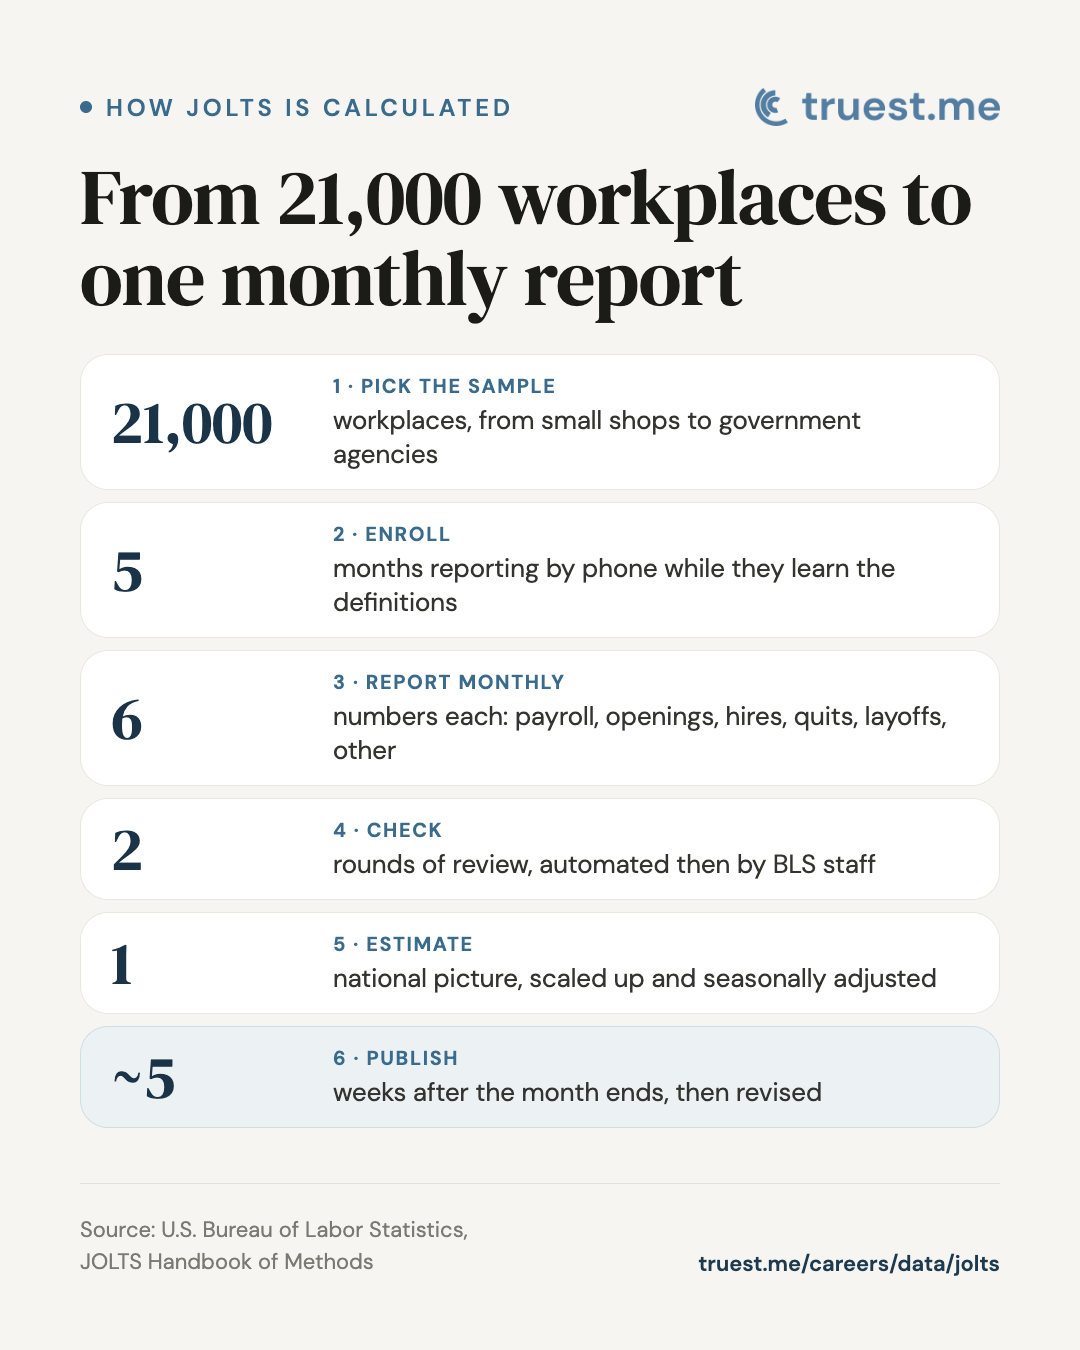
How JOLTS is calculated
September 2026 data. 1080×1350, sized for LinkedIn and Instagram. New versions with each release.
What is JOLTS, and how does it work?
For decades, the U.S. measured one side of the job market well: how many people were out of work and looking. There was no official measure of the other side, the jobs employers couldn’t fill. The Bureau of Labor Statistics built JOLTS to close that gap. Its first data covers December 2000, and today economists, policymakers, and reporters use it to judge how tight or loose the job market is.
How are JOLTS figures calculated?
From a survey of 21,000 workplaces to one national monthly report.
- Pick the sample21,000workplaces
From small shops to government agencies, drawn from a list covering about 95% of U.S. jobs.
- Enroll5months by phone
A packet in the mail, then an interviewer calls while each workplace learns the definitions.
- Report monthly6numbers each
People on payroll, openings on the last business day, and the month’s hires and separations.
- Check2rounds of review
Automated checks, then BLS staff screen reports again for errors.
- Estimate1national picture
Scaled up to the whole economy, with new businesses and seasonal swings accounted for.
- Publish~5weeks later
The prior month is revised, and every year BLS revises the last five years.
JOLTS covers all nonfarm employers, private and government, in the 50 states and DC. It leaves out farms, private households, and the self-employed.
How to read the JOLTS report
Use rates, not counts
Rates adjust for a growing workforce. Seven million openings meant something different in 2001 than today.
Read the numbers in pairs
Openings next to hires shows whether demand turns into jobs. Quits next to layoffs shows who’s ending jobs.
Don't overreact to one month
Many monthly changes are within the margin of error. Look at three months or more.
Expect revisions
Each release revises the prior month, and each year BLS revises five years.
An opening isn't a hire
Some roles stay open for months, and some never get filled.
It's national
There’s no city-level JOLTS, and state numbers now come out once a year.
JOLTS vs. the jobs report and the unemployment rate
The jobs report
The jobs report gives the net change: jobs added or lost. JOLTS shows the movement underneath, like deposits and withdrawals behind a bank balance.
Unemployment
In September 2026 there were about 7.5M openings and 7.1M unemployed people, roughly 1.1 openings per job seeker.
QCEW
JOLTS samples from the Quarterly Census of Employment and Wages, a near-complete count of jobs from unemployment-insurance records.
Job-posting data
Indeed and LinkedIn track postings daily and by city. Faster and more local, but a posting isn’t an opening, and methods vary.
Common questions about JOLTS
What is JOLTS?
JOLTS, the Job Openings and Labor Turnover Survey, is a monthly report from the U.S. Bureau of Labor Statistics. It counts job openings, hires, quits, layoffs, and other separations across the country, based on a survey of about 21,000 workplaces.
Is the job market good right now?
It depends which side you're on. In September 2026 there were 7.5 million job openings and 7.1 million unemployed people, about 1.1 openings per job seeker. Layoffs were 1.0% of workers, and the hiring rate was 3.4%, compared with 3.9% in 2019. Fewer people losing jobs, and fewer getting hired.
Why is it taking so long to find a job?
Part of it is the market. The hiring rate tells you what share of workers were newly hired in a month: 3.4% in September 2026, below the 3.9% average of 2019. When fewer people get hired each month, searches take longer for everyone, and a slow search isn't a verdict on you.
Is it a good time to switch jobs?
JOLTS can't answer that for you, but it shows how the people around you are moving. In September 2026 the quits rate, the share of workers who left by choice, was 2.1%, against 2.3% in 2019. Higher quits tend to mean more workers feel they have options; lower quits mean more people are staying put.
Is JOLTS the same as the jobs report?
No. The jobs report (officially the Employment Situation) shows how many jobs were added or lost and the unemployment rate. JOLTS shows the openings, hires, and departures behind that net number. Both come from the Bureau of Labor Statistics.
Why is JOLTS a month behind the jobs report?
JOLTS takes longer to collect and process. It comes out about five weeks after the month it covers, so September 2026's JOLTS came out Nov 3, 2026, about a month after September 2026's jobs report.
Does a job opening mean a company is hiring?
It means the employer says a specific job exists, could start within 30 days, and that it's actively recruiting from outside. It doesn't mean the job will be filled soon, or at all.
Where can I find JOLTS for my state?
BLS now publishes state JOLTS once a year instead of monthly. The latest state release came out July 22, 2026 and covers 2025. There's no official JOLTS for cities or metro areas.
How reliable is it?
JOLTS is a survey of about 21,000 workplaces, so each estimate has a margin of error. BLS flags which monthly changes are statistically meaningful, revises recent months as more reports arrive, and benchmarks the data every year.
Sources
- BLS, Job Openings and Labor Turnover Summary, September 2026 (released Nov 3, 2026)
- BLS, Employment Situation, September 2026
- BLS, JOLTS Technical Note (definitions and methods)
- BLS Handbook of Methods, JOLTS data sources
- BLS, JOLTS Overview
- Federal Reserve Bank of St. Louis, FRED (monthly JOLTS rates since 2000)
✦ Editorial, written from BLS releases and methods documentation. Updated each month when JOLTS is released.
Cite this page
Truest. “The job market right now: openings, hiring and quits (JOLTS).” Updated Nov 3, 2026 with September 2026 data. https://www.truest.me/careers/data/jolts